To communicate results, the importance of data visualization can't be overemphasized. In this article, I plot several figures to show the colors, markers and line styles in Matplotlib.
1. Colors
Matplotlib.colors supports several formats to specify the colors, including:
- A single letter for basic built-in colors, like
rrepresenting'red' - Legal html names for colors, like
red,burlywoodandchartreuse - Gray shades, a string encoding a float in the
0-1range, such as'0.75' - Html hex string, like
'#eeefff' - A tuple
(R, G, B)where each of R , G , B are in the range[0,1], e.g.,(0.75, 0, 0.75)
1.1 Basic built-in colors
Undoubtedly, the basic built-in colors are the most commonly used in practice.
- b: blue
- g: green
- r: red
- c: cyan
- m: magenta
- y: yellow
- k: black
- w: white
matplotlib.colors.ColorConverter.colors returns a dict of basic buil-in colors a single letter : (R, G, B).
>>> import matplotlib
>>> matplotlib.colors.ColorConverter.colors
{u'b': (0.0, 0.0, 1.0),
 u'c': (0.0, 0.75, 0.75),
 u'g': (0.0, 0.5, 0.0),
 u'k': (0.0, 0.0, 0.0),
 u'm': (0.75, 0, 0.75),
 u'r': (1.0, 0.0, 0.0),
 u'w': (1.0, 1.0, 1.0),
 u'y': (0.75, 0.75, 0)}
I plot these colors on a figure, as shown below,
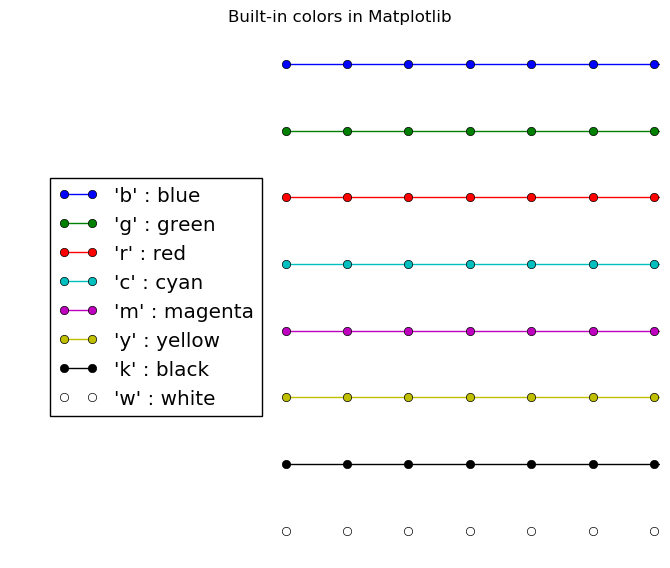 Fig. 1: Single letter colors
Useful links:
- HTML Color Names
- Demo: Named colors
2. Markers
matplotlib.markers is used by both the marker functionality of plot and scatter. All possible markers list here can be returned from matplotlib.lines.Line2D.markers. Personally, 13 filled markers (filled_markers) is enough for me.
filled_markers = ('o', 'v', '^', '<', '>', '8', 's', 'p', '*', 'h', 'H', 'D', 'd')

for idx, marker in enumerate(filled_markers):
    y = [-idx]*5
    ax.plot(y, 'o', marker=marker,
                    markeredgecolor='k',        # mec
                    markerfacecolor='b',        # mfc
                    markerfacecoloralt='r',     # mfcalt, set the alternate marker face color
                    markeredgewidth=1.0,        # mew, float value in points
                    fillstyle='none',           # fillstyles = ('full', 'left', 'right', 'bottom', 'top', 'none')
                    markevery=None,             # [None | int | length-2 tuple of int | slice | list/array of int | float | length-2 tuple of float]
                    markersize=8, label=repr(marker).replace('u', ''))
Filled markers:
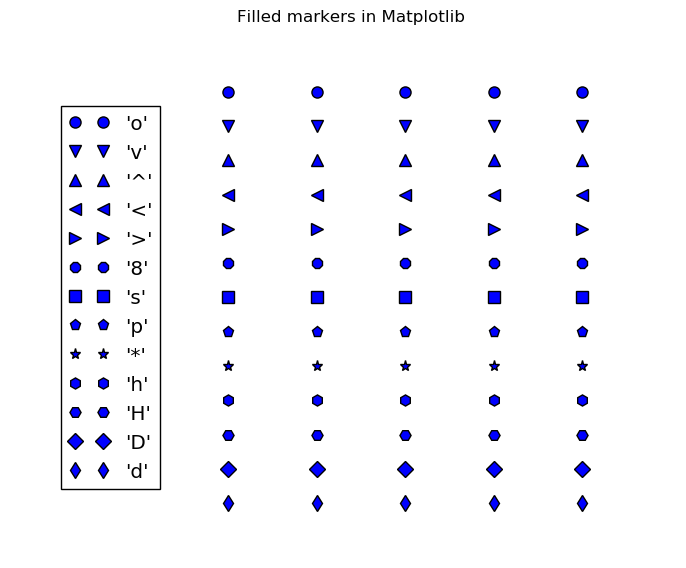
Fig. 2: Filled markers
All possible markers:
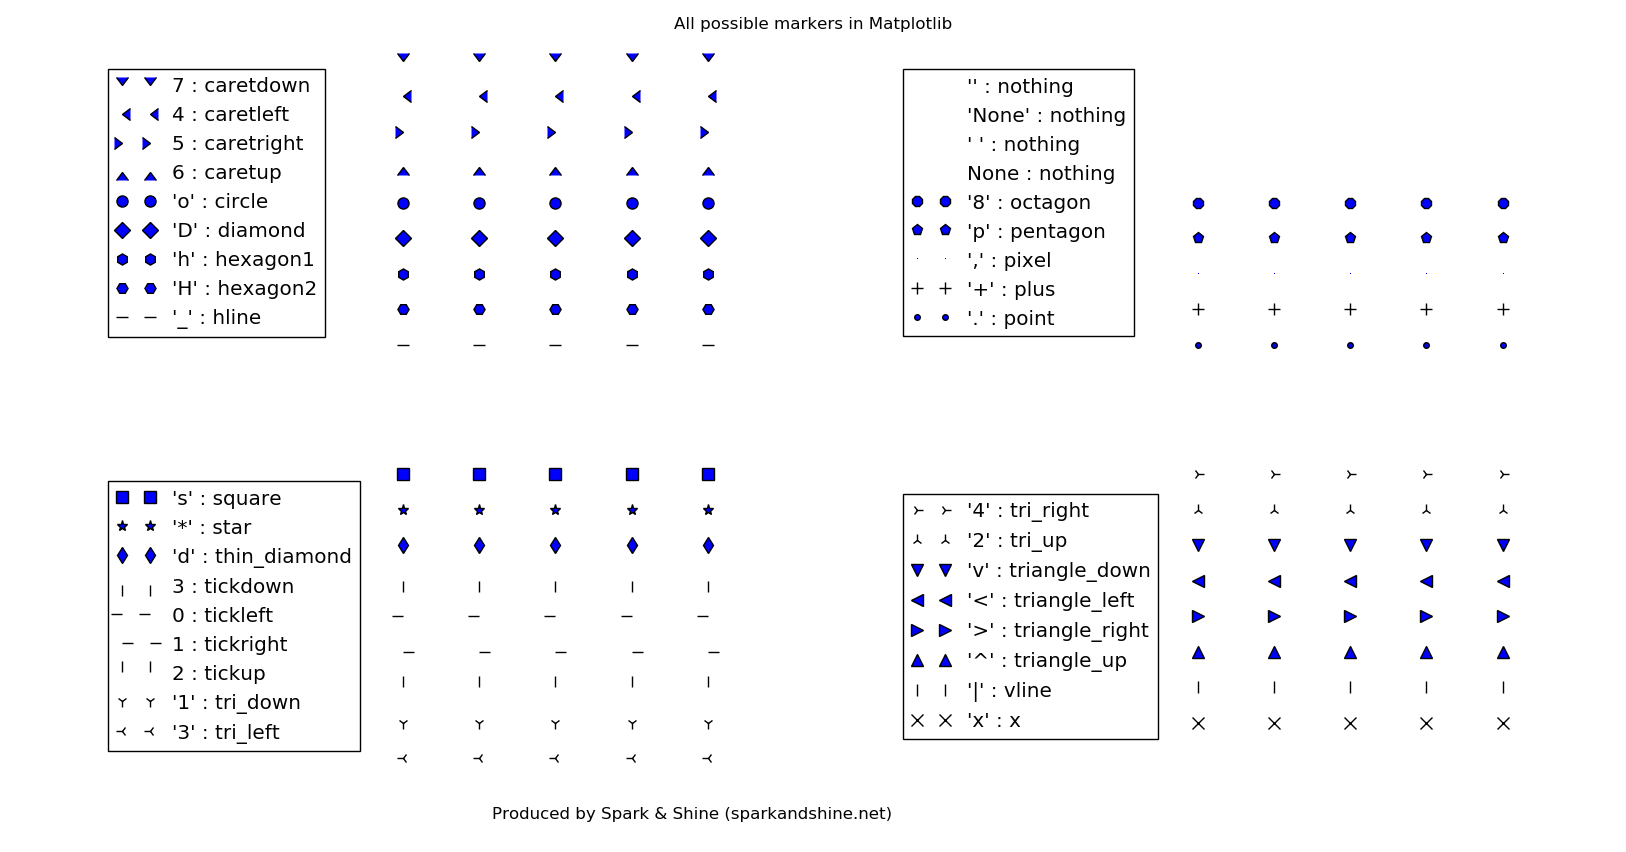 Fig.3: All markers
3. Line styles:
matplotlib.lines.Line2D.lineStyles returns all line styles.
linestyles = matplotlib.lines.lineStyles
linestyles_sorted = sorted(linestyles.items(), key=operator.itemgetter(0), reverse=True)

for idx, (linestyle, s) in enumerate(linestyles_sorted):
    y = [-idx]*5
    ax.plot(y,  linestyle=linestyle,        # ls, ‘solid’ | ‘dashed’ | ‘dashdot’  |  ‘dotted’ | (offset, on-off-dash-seq)
                                            # ls,   '-'   |    '--'  |    '-.'    |     ':'   | 'None' | ' ' | ''
                linewidth=3,                # float value in points
                color='k', label=repr(linestyle).replace('u', ''))
The line styles are presented below.
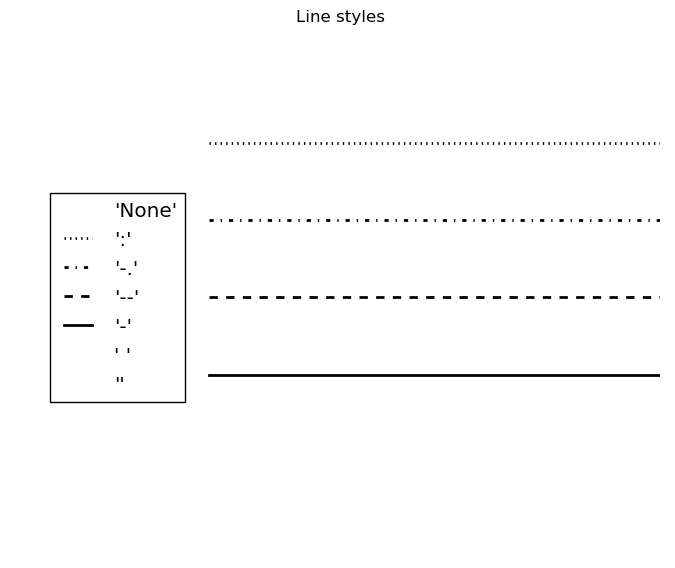 Fig. 4: Line styles
PS: The source code is hosted on my GitHub, here.